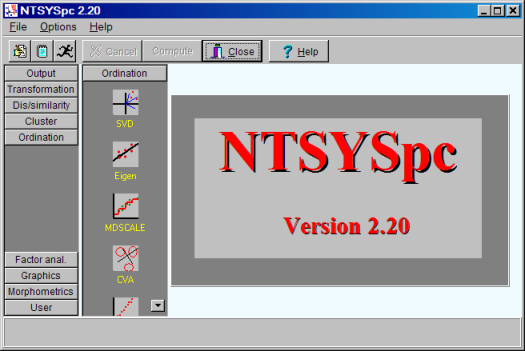
Computational modules are run from the main window by selecting a tab corresponding to a group of modules and then clicking on the Compute button. A sample is shown below.
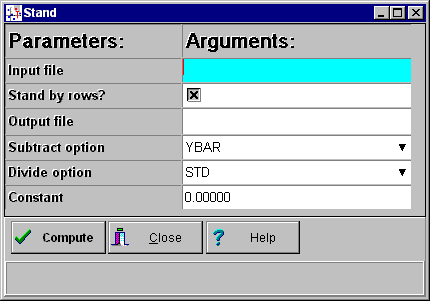
The parameters for each module are provided on an parameter entry window. An example is shown below for the STAND module.
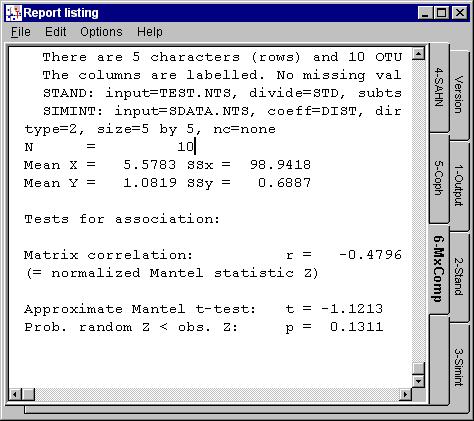
Summary information is written to a listing window that you can review, print, edit, and save to a file. A sample is given below after several modules have been run.
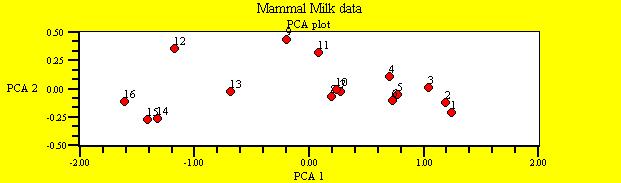
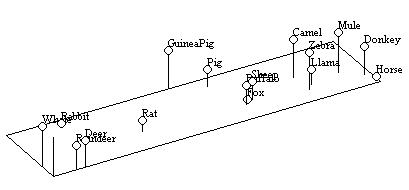
Plotting options allow you to customize many attributes of a plot. An example of an "enhanced" plot is shown below. It is a
plot of one variable against another. 2D and 3D scatter plots can be made of,
for example, the projections of points onto the first few PCA axes (note that the axes can be forced to have the same scale factor).
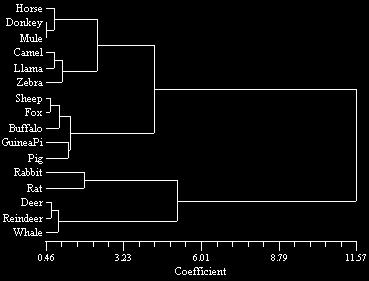
Tree plots show the results of cluster analyses such as UPGMA, neighbor-joining, and others.
3D plots show the results of ordination analyses such as PCA, MDSCALE, and others.
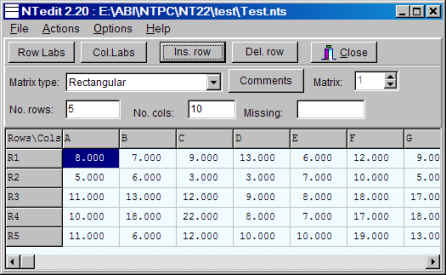
A new data editor is included with NTSYSpc. It makes it easy to create files in the proper format. A typical view is shown below.
This file was last modified on 9 September 2018.